GDB-dashboard
Introduction
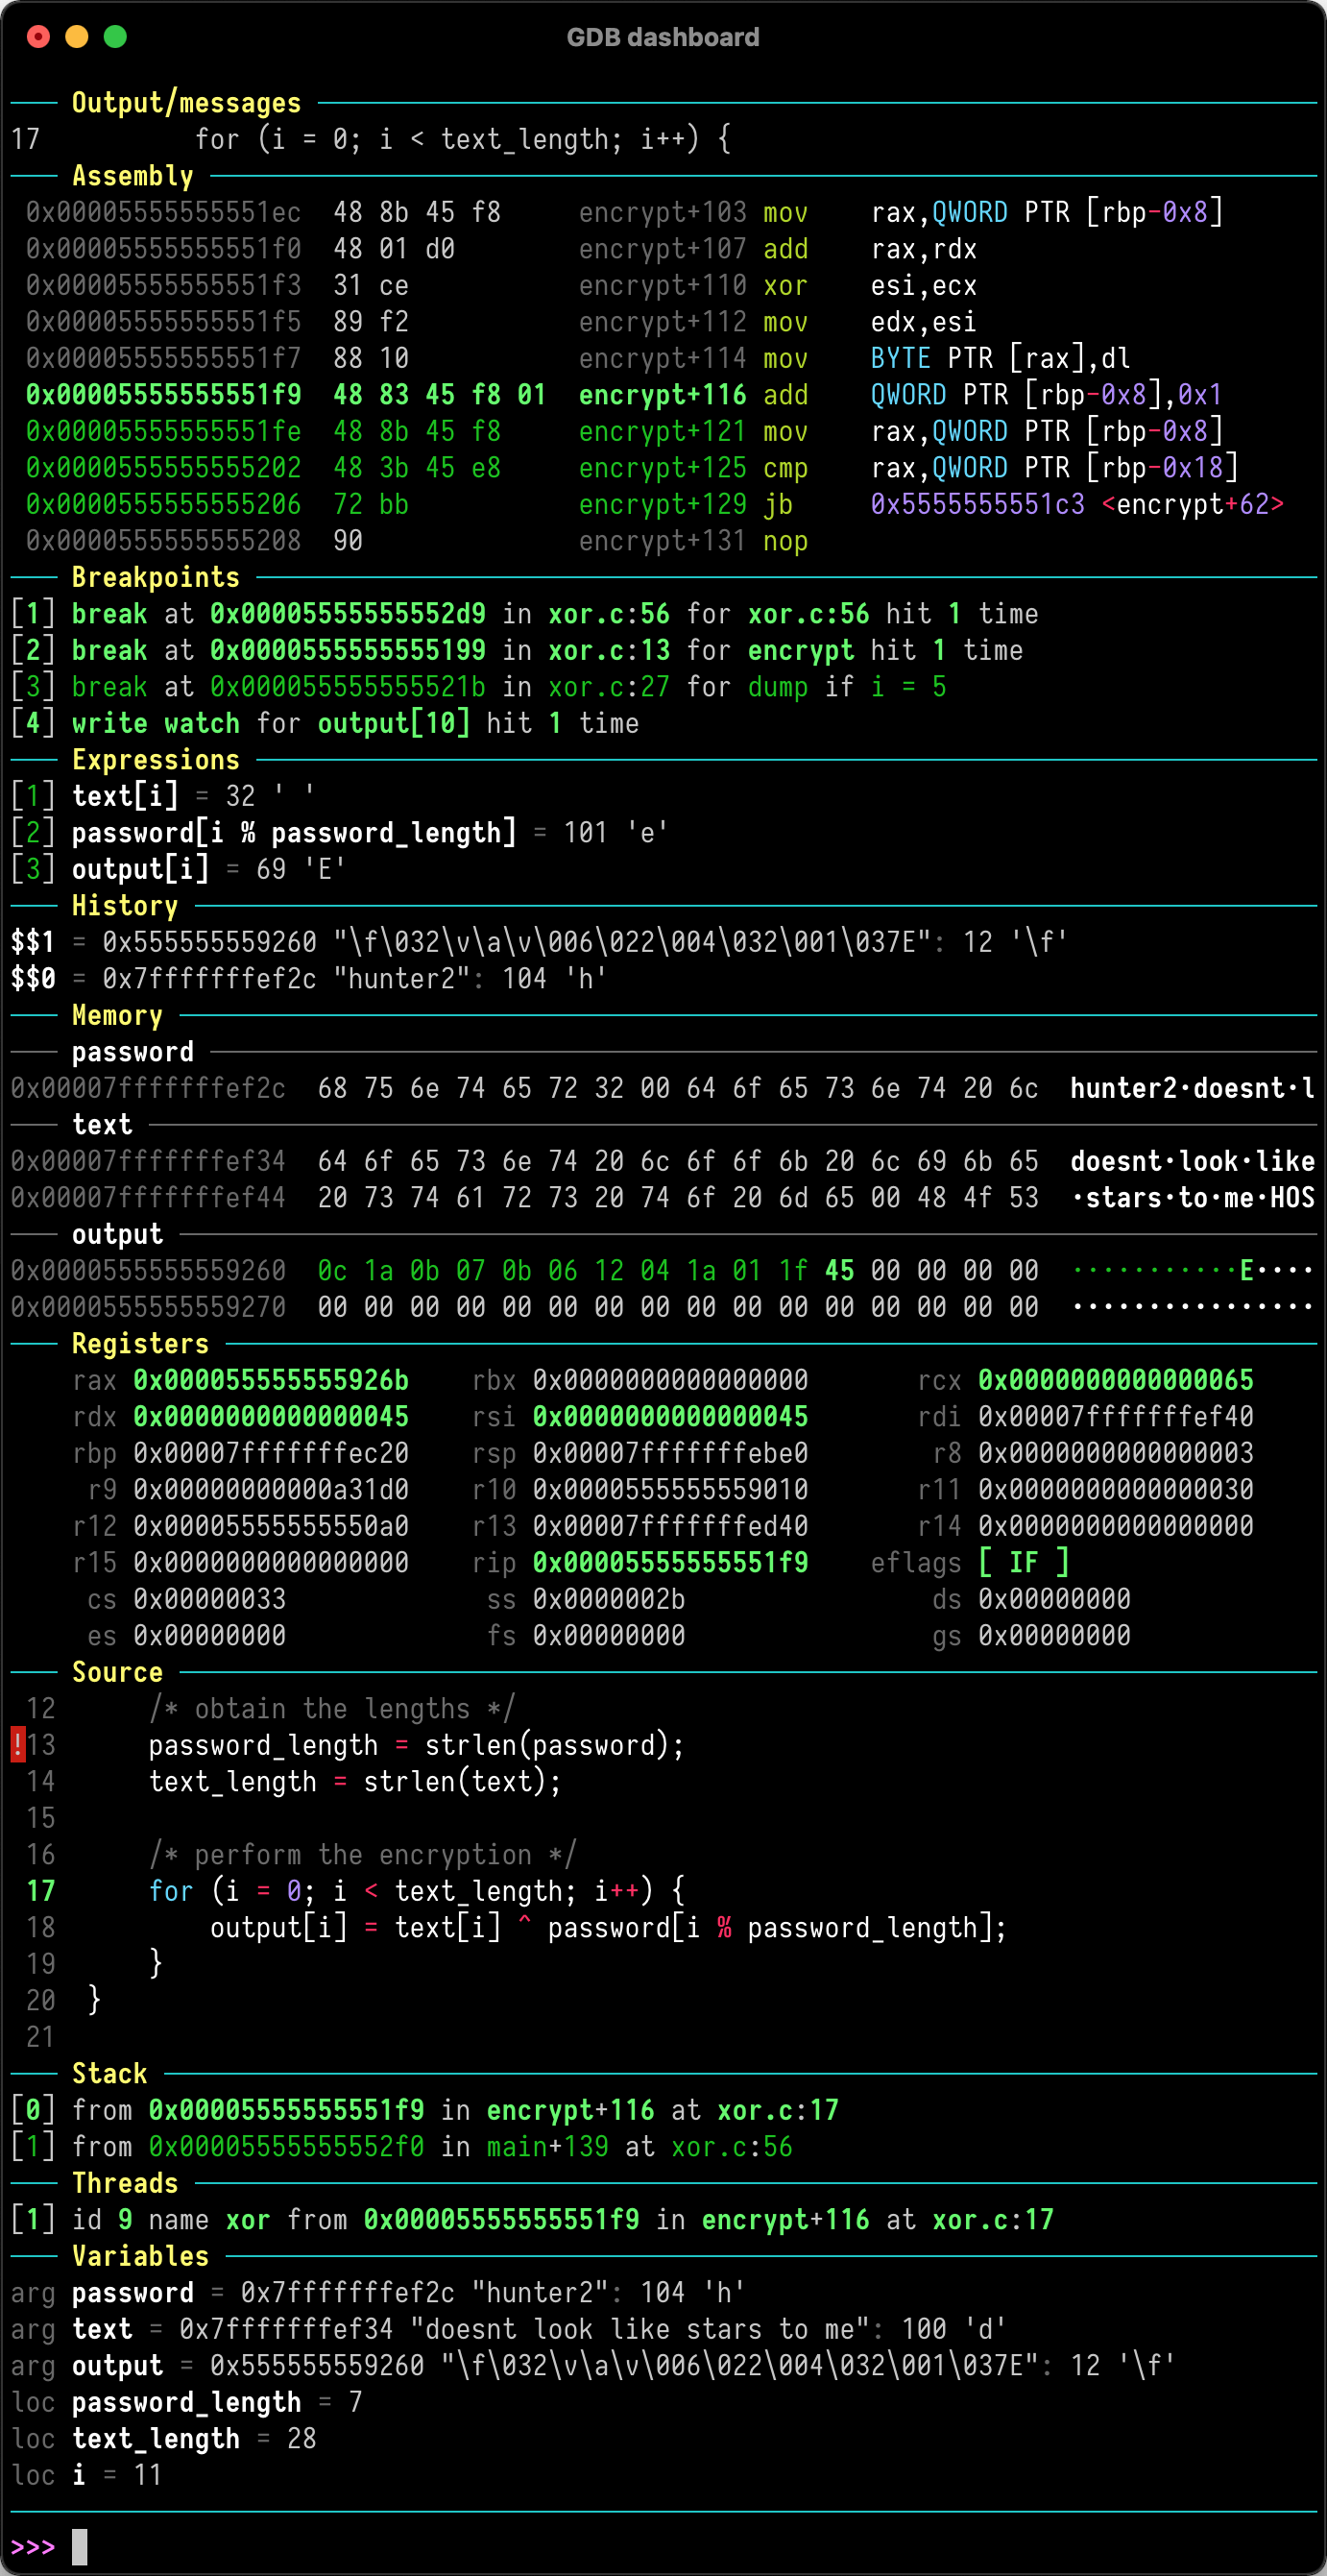
Using python to configure the gdb debugging interface, you can write your own code to define the entire debugging interface. It can be said that it is comparable to an IDE, and the display is also very good-looking. It is completely based on the terminal. As the underlying debugging software, it can help developers better view variables and registers. , single-step execution, etc.
install
-
open source address: https://github.com/cyrus-and/gdb-dashboard.git
-
get it
wget -P ~ https://git.io/.gdbinit # If the network speed is slow, you can directly create a new file with the same name. gdbinit and then copy and paste it
- renderings
Recommended reason
It is true that the IDE integrates a lot of debugging tools at present, but GDB still plays an irreplaceable role in some kernel programming or other low-level development fields. For this reason, we hope to find a more observable page in the original boring debugging terminal. Fortunately, someone has helped us to realize this tool, we hope to bring such convenience to everyone.
Run and debug basic commands
Reference common commands for gdb debugging
Notice
When using this plugin, you need to check whether the gdb currently in use supports python scripts. When Scripting in the "Python" language is not supported in this copy of GDB. appears, it indicates that the gdb does not support python scripts and cannot be used this plugin. In addition, you also need to pay attention to whether the versions of gdb and python match, see issue.